~
We previously looked at the figures offered in the Singstat report and it suggests that all is well and that the economy is constantly improving in the country. This article will look at figures from around the world to examine how good the numbers for key income trends really are when compared to the rest of the world.
1. Singapore’s Median Household income is higher than most countries.
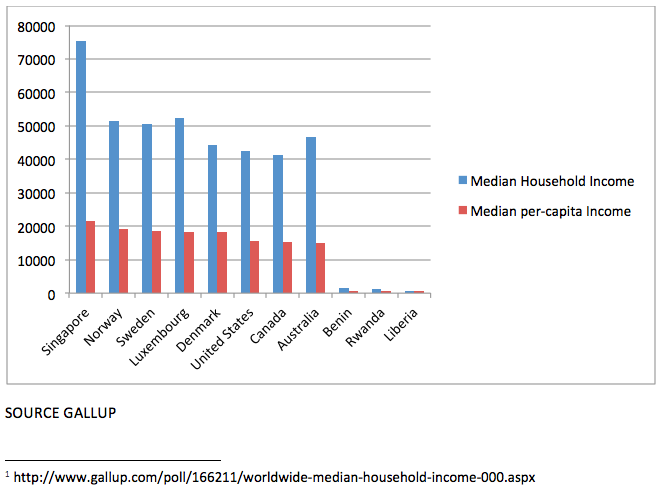
The increase in the amount of the median household income for household where at least one person is working has increased from S$7,570 (6,050 USD) in 2012 to S$7,870 (6,290 USD) monthly in 2013 according to the report. This means the median household income is 75,480 USD annually. According to Gallup, the median annual household income worldwide is 9,733 USD, and the median per-capita household income is 2,920 USD. The figure for median per-capita household income in Singapore is S$2,247 per month (21,480 USD annually), up from S$2,127 (20,400 USD annually). So, according to the report, both the figures for household income and per capita income show that Singapore are far ahead of the respective worldwide medians. Gallup’s polls put Norway at the top of the figures with median household income at USD 51,489 and per capita income at USD 19,308. Benin, Rwanda and Liberia are among the lowest earning countries and you can see how ridiculously unequal income distribution is across the world.

However, we need to note the figures in the Singstat report are tabulated only for households where at least one person works and do not take into account households where no one is working. The government puts the amount of households where at least one person works at 91 percent of all households with 9 percent of households comprising of “retirees” (households made up of non-working people aged 60 and over). These non-working households may have income from non-work sources, e.g. income from rental, investment, contribution from relatives/friends, social welfare grants, etc.
2. GINI coefficient decreased.
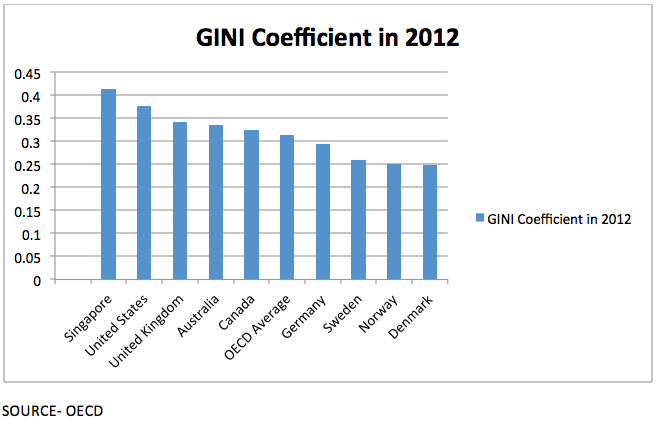
The GINI coefficient stood at 0.463 in 2013 in Singapore before taxes and transfers, and 0.412 after taxes and transfers. However, Singapore calculates the GINI coefficient based on household income from work per household member, unlike OECD which uses a “square root scale” to take into account the fact that households may enjoy certain economies of scale because they can share the income between the members of the household. By any measure, Singapore does have one of the worst income inequalities in the group of economically developed OECD countries. Singapore’s GINI coefficient was the highest in 2012. It went down in 2013.
Since the 2013 figures for other countries are not widely available, we will compare 2012 figures. Doing so will still give us a general idea of how income distribution in Singapore stacks up against the other countries.

In 2012, according to OECD, Singapore had the highest GINI coefficient among OECD countries at 0.414, with the United States second at 0.378, and Denmark the most equal at 0.248. However, the report indicates that government schemes have increased redistribution of income. This is the reason why we are witnessing a decrease in Singapore’s GINI coefficient in 2013.
To see more of such posts, please Like our Facebook page:


